Earlier this year, we created the Higher Education Diversity Index Tool, which analyses a school's average net price by the percentage of students who are white, non-hispanic. One follow-up question that arose after reviewing this small research project was: Affordability for whom? Using the same data, we decided to dive deeper into this exploration by analyzing affordability as it relates to household income and types of Ethnic Minority-Serving Institutions (MSIs) across the United States. We recently had a Q&A session with ESI's Lee Huang (LH), Ardy Wurtzel (AW), and Al-Jalil Gault (AG) to capture interesting insights and findings from the data.
To access the interactive data seen below, click the image below or click here.

AW: Higher Education has, on average, become more expensive this decade for Hispanic Serving Institutions (HSIs), Historically Black Colleges and Universities/Predominantly Black Institutions (HBCUs / PBIs), Native American/ Non-Tribal Institutions (NANTIs), and institutions that aren't established as an Ethnic Minority-Serving Institution. These relationships are shown in Figure 2.
AG: The average net price of Alaska Native / Native Hawaiian Institutions has decreased from $13k to $11k from 2011-2018, while the average net price of Tribal Institutions has remained the same.
AW: Regardless of whether or not an institution is an MSI, lower income families, on average, receive a lower net price for higher education while at the same institutions as their classmates with higher incomes. This is shown in Figure 3.
AG: These price relationships between low-income families and high-income families are propagated throughout MSIs. Therefore, MSIs, which may already be more affordable, offer average net prices that are lower than non-MSIs for low-income families.
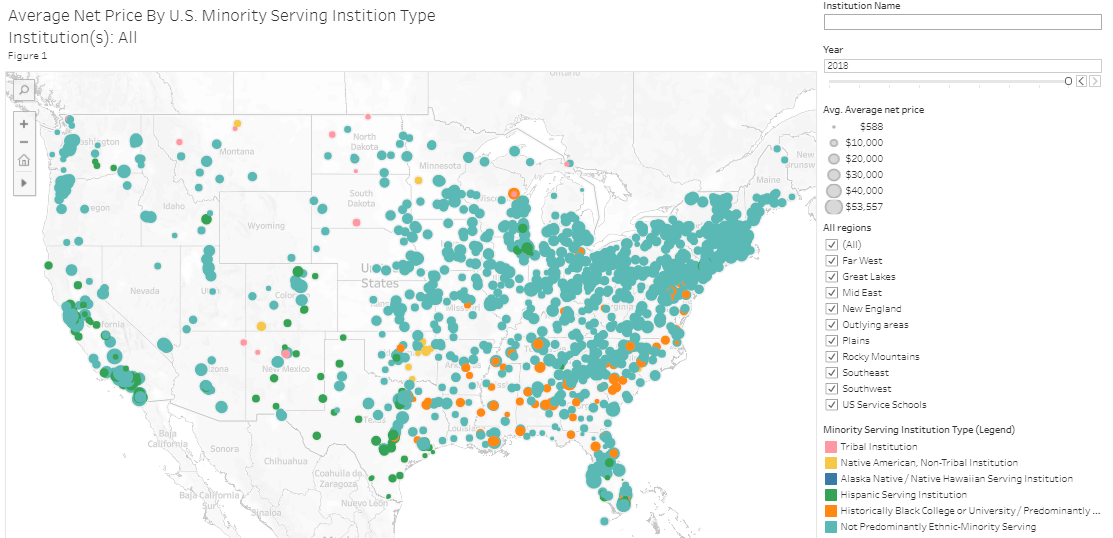
AG: By default, the map shows data for all institutions at year 2018. Figure 2 will show average net price overtime for all institutions by MSI type, while Figure 3 will show average net price in 2018 by income group and MSI status for all institutions.
AG: To view statistics for a specific institution, click that institution on the map (while navigating using pan/zoom) or search for the institution in the search bar at the top right. Figures 2 and 3 will then show affordability overtime as average net price and average net price by income group, respectively. Clicking on a blank space in the map will clear your selection.
AG: If you click on a line for an MSI type from Figure 2, the map will show how those institutions are distributed across space and their average net prices in relation to one another. Figure 3 will isolate price by income group for that MSI type. Clicking on a blank space in the chart area will clear your selection.
AG: The data come from the Integrated Postsecondary Education Data System (IPEDS) for 2011 through 2018. Only institutions that have reported average net price by income group are included in this analysis. If an institution failed to report whether or not they were an MSI (and if they were, what type), then they were also omitted from this data.
AG: Average net price is equal to cost of attendance, including room/board, supplies, etc, minus the average amount of aid awarded to students. For the various income groups, this quantity is the cost minus the average amount of aid awarded to students in an income category.
AG: It's clear that MSIs tend to be more affordable higher education options, but I'm very interested in the return-on-investment (ROI) in higher education. Even though these institutions are more affordable, what are the average wages 7-10 years after graduation? What institutions will rise with the highest ROIs? Will these returns remain consistent across income groups in all schools? Will returns be more-or-less equal between MSIs and non-MSIs
AH: It'll also be important to analyze 7-10 year loan repayment rates among graduates. Even though graduates will have wage premiums, how significant is this advantage once we evaluate student debt? Lots of data exists on this idea of "bang for your buck", even though there seems to be limited availability within IPEDS.

Lee Huang brings over 20 years of experience in economic development experience to Econsult Solutions' (ESI) public, private, institutional, and not-for-profit clients. He leads consulting engagements in a wide range of fields, including higher education, economic inclusion, environmental sustainability, historic preservation, real estate, neighborhood economic development, non-profits, retail, state and local government, strategic planning, tax policy, and tourism/hospitality, and is a sought-after speaker on these and other topics.

Ardy Lynn Wurtzel is an Associate Director at Econsult Solutions, Inc. At ESI, Ms. Wurtzel leads projects in the areas of economic development, higher education, public policy, transportation and real estate. Prior to joining ESI, Ms. Wurtzel worked as an adjunct professor of Economics at several universities, including Temple University, Arcadia University, and Rutgers University.

Al-Jalil Gault is a Research Assistant at ESI. Al-Jalil is currently studying at the University of Pennsylvania to receive his Masters in City Planning. He received his Bachelors in Architecture from Rensselaer Polytechnic Institute.